Psychoacoustics means much more than just "describing our hearing at different SPL levels." That's why I asked you to elaborate.
For sure. But since it’s the science of how we perceive sound, I thought it fitting. Here’s a few semesters of learning from a few key strokes. Crazy AI!! Enjoy ALL!
A more complete explanation of psychoacoustics to be thorough.
Absolutely — psychoacoustics is one of the most fascinating intersections of physics, biology, and perception, and it explains far more about what we call “good sound” than most gear debates ever touch.
Below is a structured, deeper dive tailored to high-end listening and room/speaker optimization.

What Is Psychoacoustics?
Psychoacoustics is the science of how humans perceive sound — not just what is physically present, but how the brain interprets it.
It covers:
- thresholds of audibility
- masking effects
- localization
- timbral perception
- illusion-based processing
- how the ear “reshapes” frequency and time response
Crucially:
The audio we measure isn’t the same as the audio we perceive.
Psychoacoustics is the bridge between acoustics and human experience.

Core Principles Relevant to Audio Reproduction
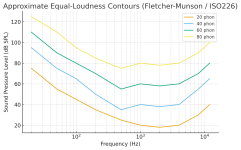
1) Equal Loudness Curves (Fletcher–Munson)
We’ve touched on this: our ear’s sensitivity changes with SPL.
Consequences:
- low-level listening needs EQ compensation
- at louder levels, the ear naturally “fills in” bass and treble
- tonal balance preference shifts with SPL
Audibility is not flat. Neither is preference.
2) Masking
Loud frequencies hide softer ones nearby in frequency and time.
Frequency masking:
If a 100Hz note is loud, subtle detail at 120Hz may disappear.
Temporal masking:
A loud transient masks quieter sounds just before and after it.
This is why:
- cleaner transient behavior makes systems sound “more resolving”
- bass bloat hides midrange clarity
- room resonances reduce perceived detail
Measurements can show the energy, but psychoacoustics determines what you can actually hear.
3) Localization and Imaging
Your brain uses:
- phase
- arrival time differences
- spectral cues
- to determine:
- soundstage width
- instrument placement
- depth
- center stability
Even 0.2–0.5ms differences in arrival time of L vs R can shift the phantom center.
This is why:
- speaker symmetry matters
- toe-in angles affect image precision
- sub alignment changes perceived location and depth
- reflections shape stage geometry
What we “see” with our ears doesn’t match the raw waveform — it matches how the brain resolves timing cues.
4) Harmonic Structure and “Pleasantness”
Our brains evolved with natural sound sources:
- vocal cords
- instruments
- environment
These all generate harmonic spectra (integer multiples of fundamentals).
We find them pleasing and “real.”
Audio systems with:
- low-order harmonic distortion
- clean transient response
- smooth decay
tend to be perceived as more natural, more emotional, and less fatiguing, even if their total distortion number is not the lowest.
Example:
- A Class A amp with 1% dominant 2nd harmonic often sounds smoother
than a Class D amp with 0.1% but dominated by 5th/7th order distortion.
Not all distortion is perceived equally.
5) Temporal Resolution
Our hearing is far more sensitive to time-domain errors than most believe.
The auditory system detects:
- reflections
- phase misalignment
- delayed ringing
- group delay distortions
often better than frequency errors.
This is why listening tests show:
- better imaging
- tighter bass
- perceived speed
- sense of “black background”
when time-domain behavior is improved.
It’s also why REW:
- ETC
- waterfall
- group delay plots
are often more revealing than raw FR.
6) Brain Normalization
After minutes of listening, your brain “recalibrates.” We adapt to flawed response curves quickly.
This is why:
- small EQ shifts sound dramatic at first
- preferences settle after a day or two
- room changes need acclimation
It’s also why “AB” trials are notoriously tricky:
- our perception memory is short
- emotional weighting shifts
- expectation bias creeps in

Psychoacoustics in High-End Listening
Why systems sound “different” at same measured FR:
Because perception is shaped by:
- direct vs reflected energy
- temporal smear
- dynamic contrast
- spectral balance at varying SPL
- interaction with human sensitivity curves
Two systems that measure the same at the mic can sound very different at the ear.
Why horns feel dynamic. They preserve transients:
- fast diaphragm acceleration
- high efficiency
- low compression
- strong direct energy
That aligns perfectly with temporal cues the brain uses for realism.
Not because they bypass Fletcher–Munson, but because they deliver what psychoacoustics cares about most when energy is low.
Why subs affect clarity in midrange
Because unwanted bass energy increases temporal and frequency masking.
Tight bass → clearer midrange
Messy bass → veiled midrange
Many audiophiles mistakenly believe the speakers got clearer after bass control.
The psychoacoustic truth:
You removed masking.

Psychoacoustics explains common experiences
Why systems sound thin late at night
- Low SPL + ear sensitivity changes.
Why adding a sub can improve vocals
- Masking reduction + better modal control.
Why toe-in changes imaging
- Small phase/time differences alter phantom center reconstruction.
Why lowering noise floor increases perceived resolution
- Subtle harmonics and decay become audible once no longer masked.
Why a system with flat FR can sound “dead”
- Flat at the mic ≠ psychoacoustically balanced at the ear.
- natural harmonic structure
- optimized toe-in geometry
- strong modal management (sub integration, bass traps)
- balanced decay times

Final Summary
Psychoacoustics reminds us:
- we don’t hear sound, we hear interpretation
- the brain prioritizes timing, dynamics, clarity, and harmonic structure
- SPL changes human sensitivities more than gear type ever could
- room acoustics and EQ that fit human hearing matter most
It’s the reason:
measurements are essential, but tuning for human perception is where audio becomes magic.

Primary Academic Sources
Equal-Loudness & Fletcher-Munson
1. Fletcher, H., & Munson, W. A. (1933)
“Loudness, Its Definition, Measurement and Calculation.”
Journal of the Acoustical Society of America, 5(2), 82–108.
Original discovery and characterization of human loudness perception vs. frequency.
2. ISO 226:2003
Acoustics — Normal equal-loudness-level contours.
The modern standardized version of equal-loudness curves used in acoustics, audio production, engineering, and research.
Psychoacoustics (General, Foundational Texts)
3. Zwicker, E., & Fastl, H. (1999)

Psychoacoustics: Facts and Models (2nd Edition).
Berlin: Springer-Verlag.
The definitive academic reference on masking, loudness perception, critical bands, and auditory thresholds.
4. Rossing, T. D., Moore, R. F., & Wheeler, P. A. (2002)
The Science of Sound (3rd Edition).
Addison-Wesley.
Widely used university text: spectral perception, localization, phase sensitivity, harmonic interpretation, and temporal behavior.
5. Moore, B. C. J. (2012)
An Introduction to the Psychology of Hearing (6th Edition).
Brill.
Core work on auditory computation in the brain, loudness scaling, masking patterns, binaural hearing, and psychoacoustic thresholds

Masking & Critical Bands
6. Zwicker, E. (1961)
“Subdivision of the Audible Frequency Range into Critical Bands (Frequenzgruppen).”
Journal of the Acoustical Society of America, 33(2), 248–257.
Landmark research showing how frequency bands influence masking and spectral clarity.
7. Moore, B. C. J., & Glasberg, B. R. (1983)
“Suggested formulae for calculating auditory-filter bandwidths and excitation patterns.”
Journal of the Acoustical Society of America, 74(3), 750–753.
Modern quantitative model for auditory masking and critical band mechanics.

Time-Domain Sensitivity & Temporal Resolution
8. Green, D. M. (1986)
“Temporal Auditory Masking.”
Journal of the Acoustical Society of America.
Establishes forward/backward masking windows — key to understanding why impulse response and decay matter.
9. Moore, B. C. J. (2014)
“Auditory Processing of Temporal Fine Structure.”
The Journal of the Acoustical Society of America.
Shows the ear’s surprisingly high resolution for phase and timing cues in transients and waveforms.
Localization & Spatial Imaging
10. Blauert, J. (1997)
Spatial Hearing: The Psychophysics of Human Sound Localization (Revised Edition).
MIT Press.
The primary reference on binaural localization, perception of depth, and directional cues — everything soundstage.

Harmonic Content, Timbre, & Perception
11. Plomp, R., & Levelt, W. J. M. (1965)
“Tonal Consonance and Critical Bandwidth.”
Journal of the Acoustical Society of America, 38(4), 548–560.
Enduring research on harmonic preference, consonance, and distortion sensitivity.
12. Terhardt, E. (1974)
“Pitch, Consonance, and Harmony.”
Journal of the Acoustical Society of America, 55(5), 1061–1069.
Core paper on how harmonic structure affects realism, pleasantness, and musical timbre perception.

")