- Thread Author
- #1
Clarisys Minuets undergoing first stage of measurement, testing and tuning at the factory.

Sent from my iPhone using Tapatalk Pro

Sent from my iPhone using Tapatalk Pro

Very cool.
I should reach out to Florian to show him how to do DOEs for optimizing Clarisys speaker R&D. This will make his R&D more effective (doing the right thing) and efficient (doing things right).
As well as show him how to perform a statistically valid MSA so that he knows with statistical rigor his measurements are accurate, precise, repeatable, and reproducible.
If you do this, then I would be interested in knowing his reaction, including his view on how your recommended approach compares to his existing approach.


What is DOE?
Design of experiments
Would Clarisys speakers be a good alternative to let's say a Magico or YG?
If one wanted to "listen" to another type of speaker that isn't a dynamic cone driver?
I prefer a sealed box dynamic driver speaker and my ears can't adjust to a Wilson and or another ported box speaker.
As much as I've tried to force my ears to enjoy such designs (ported box speakers)
The mid bass suck out and non-linearity compared to a Magico or YG doesn't do it for me.
So, brings me to investigate Clarisys
Yes, so would I. I know Florian, so my thought is he'd be open to considering it.
By way of some background, I did a DOE when I integrated my REL sub to my 2-channel "mains" some years ago. Used JMP as the stats package.
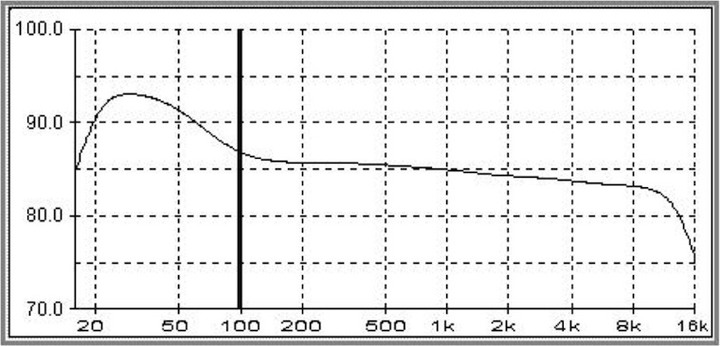
Used the Harman curve as the orthogonal reference:

DOE table from JMP. The DOE model was WAY significant with a p-value of 0.006 with α=0.05 and β=0.10
The R-Square and R-Square Adjusted was also really good at 0.97 and 0.95, respectively. Overall, a very "solid" model.

The model told exactly where to set the controls on the REL to match as closely as possible, the Harman curve.
Actual, in-room measured data plots from the listening position using a NIST-traceable calibrated mic from Before the DOE in Blue, and After the DOE in Green. The actual in-room, real-world measured green trace matched the "theoretical" Harman curve pretty nicely.

A Response Surface plot also showed this really interesting node at 155 Hz from before doing the DOE; you can see the shape of it here.

Did this DOE while at home from work after a surgical procedure; I was bored at home and needed to do some "bench science" as we say when workin' in the lab...
Thats a pretty bumpy ride , 5db scaling instead of 12db would show more details ....
While never at your level of understanding Stephen, I used DOE / Taguchi to setup and run multi variant experimentation in a lab 40 yrs ago. It was cutting edge and the IBM PC-XT was a critical tool. WOW. The good old days.
